
Some D2C Startups Are 10X-ing Revenue While Others Scramble for Bridge Rounds. What's the Difference?
It's not the product. It's not the team. It's the one GTM mistake that's burning through your runway and the counterintuitive strategy that's actually working.

Do you know which are the fastest-growing rich towns in India?
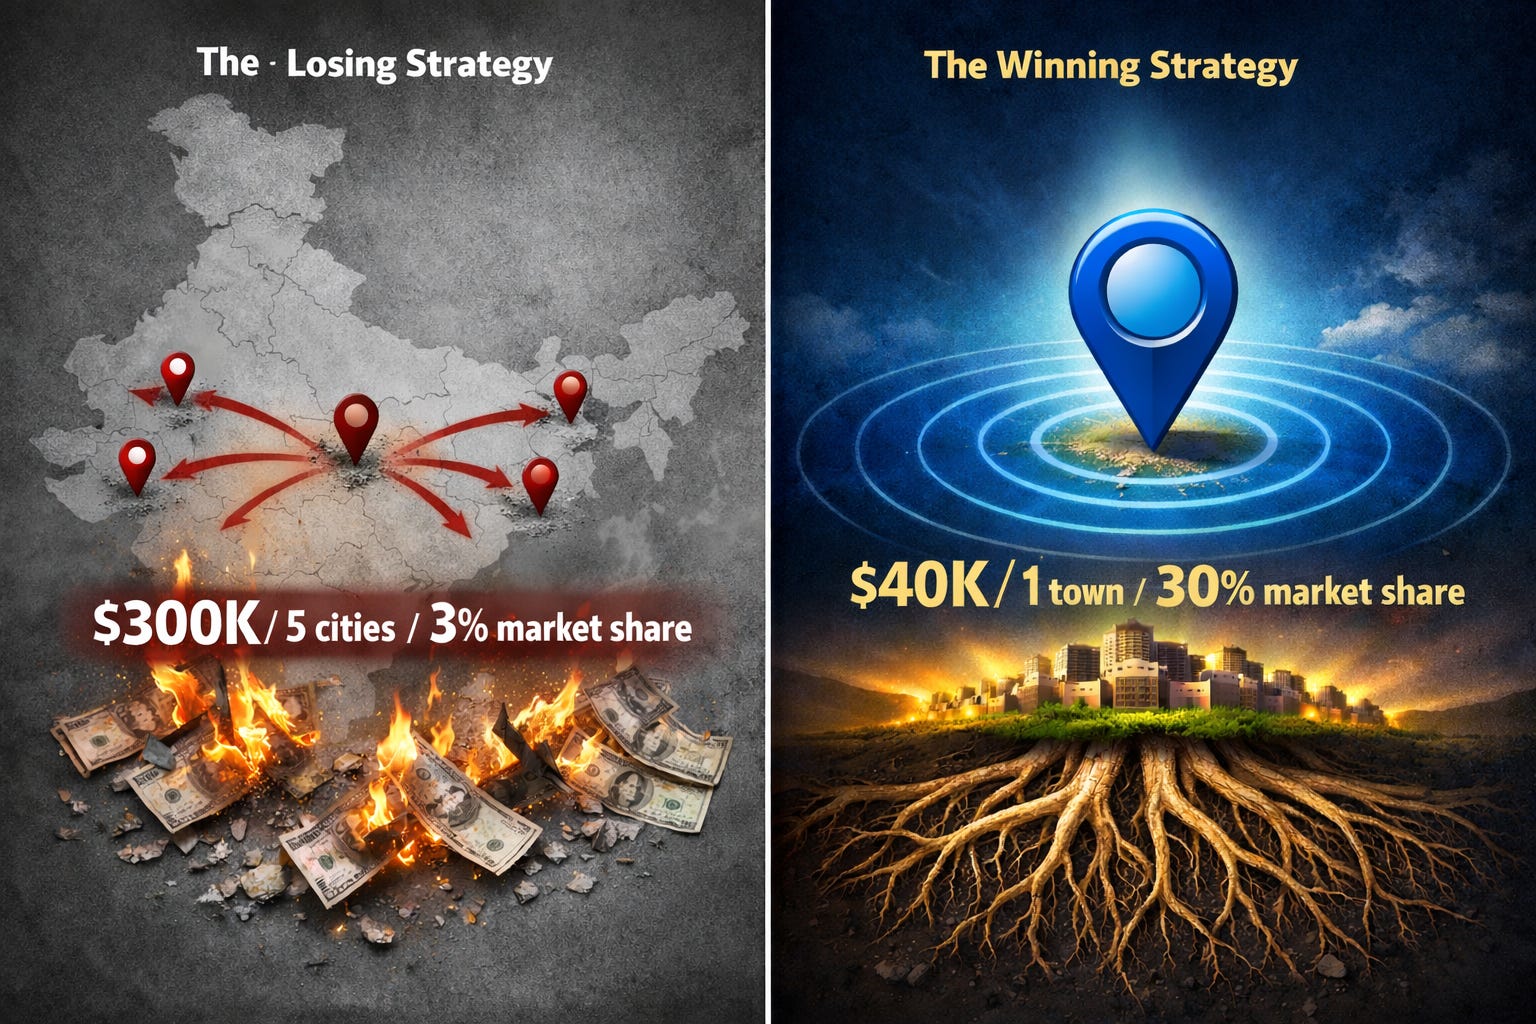
Hint: It’s not Bangalore, Mumbai, or Delhi. And that $300K mistake is killing your startup.
I was on a call last month with a founder from Indore. Smart guy. Great product. Just raised $300K. His Bangalore-based investors told him: “Launch in Bangalore, Delhi, Mumbai, Pune, and Hyderabad. That’s where the customers are.” So that’s what he did. And it was unclear which category of household was he going after?
Six months later? $200K burned. 3-5% market share everywhere. CAC climbing. Growth stalling. Now scrambling for a bridge round.
Here’s the irony: While he was bleeding cash in Bangalore, the real boom towns, places like Malappuram, Nashik, and Surat were seeing explosive income growth, lower competitive intensity, and customer behaviors perfectly aligned with his product.
He could have owned Nashik with $40K, targeted specifically the Strivers or The Near Rich household with clear knowledge of where they are located. Built 30%+ market share. Created a playbook that actually worked. Then scaled from strength.
This Isn’t Just an India Problem. It’s a Precision Problem.
Before I show you the Indian playbook, let me show you three companies that cracked this code globally.
DoorDash started in Palo Alto, California literally calling themselves PaloAltoDelivery.com. Not San Francisco where Uber Eats and GrubHub were already fighting. Not New York with its established delivery infrastructure. Palo Alto. Population: 68,000.
Why? Because in 2013, delivery services didn’t exist there. The founders spent over a year owning Palo Alto and Mountain View before expanding to San Francisco, Boston, and Chicago in 2014. Stanley Tang, co-founder, said it explicitly “Instead of going head to head with competition in the cities, they focused on underserved markets.”
Result? DoorDash now holds 60%+ U.S. market share. They’re the largest food delivery platform in America.
Pinduoduo in China went even more contrarian. While Alibaba and JD.com fought for tier 1 cities (Beijing, Shanghai, Guangzhou, Shenzhen), Pinduoduo launched in 2015 targeting tier 3, 4, and 5 cities the small towns everyone else abandoned when they went upmarket.
The data was clear, over 70% of China’s population lives in tier 3+ cities. These weren’t poor markets. They were price-sensitive markets with growing incomes and zero competition. Pinduoduo hit $15 billion in GMV in just 2 years. It took Alibaba 5 years to reach that milestone. JD.com took 10 years.
Today? 900 million users. China’s third-largest e-commerce platform.
Bolt (Europe’s ride-hailing giant) started in Tallinn, Estonia. Population, smaller than Leeds, UK. Founder Markus Villig, at 19, borrowed €5,000 from his parents and built a taxi app not in London or Paris where Uber was burning billions, but in Tallinn.
Then they went where competitors weren’t: Azerbaijan, Malta, Georgia, Czech Republic. Then Africa, South Africa, Kenya, Nigeria. Only later did they attack Western Europe.
Result? €2 billion revenue in 2024. 150 million customers across 50 countries. 21% of African ride-hailing market share.
The pattern is clear: Palo Alto before San Francisco. Tier 3 China before Beijing. Tallinn before London.
Precision before presence. Ownership before awareness.
Now Let’s Talk About India
Even if you want to go after metros, each metro is no longer a homogeneous location for many business segments. You have to think of micro townships.
India is not one market it’s 9 metros, 16 boom towns, and 38+ niche cities. Even within metros, it’s micro markets.
And the winners in India are following the exact same playbook as DoorDash, Pinduoduo, and Bolt.
Meesho is the poster child. While Flipkart and Amazon fought in metros, Meesho went after tier 2 and tier 3 cities with laser focus. Today, 80%+ of their orders come from tier 2/3 cities. They have 100 million+ transacting users and crossed $1 billion in revenue. 87% of their customers are from outside the top 8 cities.
They didn’t compromise. They chose precision.
The Fyn Mobility Playbook: Domination Over Distribution
I coach the CEO of Fyn Mobility, an EV startup focused on last-mile delivery and logistics solutions in India. While competitors burned cash across 15+ cities trying to be “pan-India,” Fyn built absolute density in micro towns.
Here’s what actually happened:
EV logistics solutions are capex and operations intensive given the multiple dimensions of vehicles, drivers, real time rostering, and EV servicing you have to manage at a low unit cost per ride for the customer.
The typical playbook: Given the explosive growth of 10-minute deliveries in metros, many players like Bounce, Vogo, Magenta, Zyngo, Zovo jumped into servicing metro areas. In the early years metros was the only place EVs were being deployed given the infrastructure required for charging and servicing. Players raised anywhere from $5M to $15M and launched across 8 cities, hired city managers, launched brand campaigns, and burned through their cash in 9 months or less. Many have shut down operations, scaled back drastically, or pivoted to a completely different business to survive. Some of them eventually had raised upwards of $30 Million.
The Fyn approach: In 2021, coming out of COVID, we were at a crossroads with scattered operations in 4 cities and revenue trajectory stalling. We decided to go deep and analyze each market from first principles.
The questions we asked were:
What behaviors are driving demand for 2-wheeler EVs?
Quick commerce was the driving factor. Large players were anchoring consumer behaviors to instant deliveries, and EVs were economical at scale for them.If it was indeed quick commerce, where was the demand density even within metros?
We realized that even within Bangalore (from a quick commerce and hence EV perspective) there are 9 different micro townships.What were these micro townships?
We found three of the largest hubs with the most demand for two wheeler EVs - Mahadevpura, Yeshwantpur and Chandapura.In those micro townships, who were the dominant customers?
BigBasket, Amazon, Swiggy, Instamart, Shadowfax.
The decision: Focused capital deployment in these demand rich micro townships where the highest density of quick commerce demand existed.
The results:
Built category leadership in the largest EV-usage micro-markets
Achieved higher vehicle utilization than industry benchmarks
Created a clear path to profitability in these markets
Scaled from a position of strength and the same model today is deployed in Chennai and Hyderabad.
This isn’t luck. It’s precision.
There are two dimensions critical to success when you are scaling your startups in any country:
Precise targeting of geographical locations you can compete and own in a short period of time. Whether they be Tier 3 towns or micro markets, you have to know the location focus.
The household category in that location to be targeted based on affordability and share of wallet you can capture/displace/incentivize to acquire.++
++ I am keeping it a little simple here but #2 above needs some more work. And you will see why below.
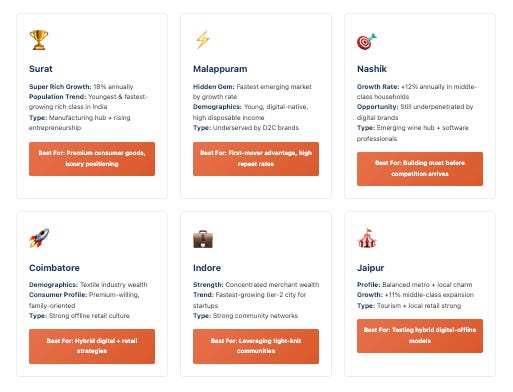
The Boom Towns You’re Ignoring
Let me show you what the data actually says about India’s fastest-growing consumption centers.
While founders obsess over Bangalore and Mumbai, cities like Malappuram, Nashik, and Surat are seeing:
Rising household incomes at rates exceeding metros
Growing middle-class populations with high purchase intent
Lower competitive intensity across most consumer categories
Better CAC economics (40-60% lower than metro averages)
Higher word-of-mouth velocity (tighter social networks)
Malappuram, for instance, has one of the highest per-capita banking deposits in Kerala, a direct indicator of purchasing power. Yet how many consumer startups are targeting it specifically?
Nashik and Surat are both economic powerhouses with manufacturing wealth, growing professional classes, and consumption patterns that mirror metros from 3-5 years ago. That lag? That’s your opportunity window.
These aren’t compromise markets. They’re precision targets.
The startups dominating these boom towns aren’t settling for second-tier cities.
Now some startups claim they are focusing on Bharat 2.0 the tier 2, 3 towns yet their approach does not reflect that aspiration in actual execution.
But Geographic Precision Isn’t Enough. You Need Household Precision Too.
Here’s the part most founders miss. Not all households in Nashik are your customers. Not all households in Surat matter for your product.
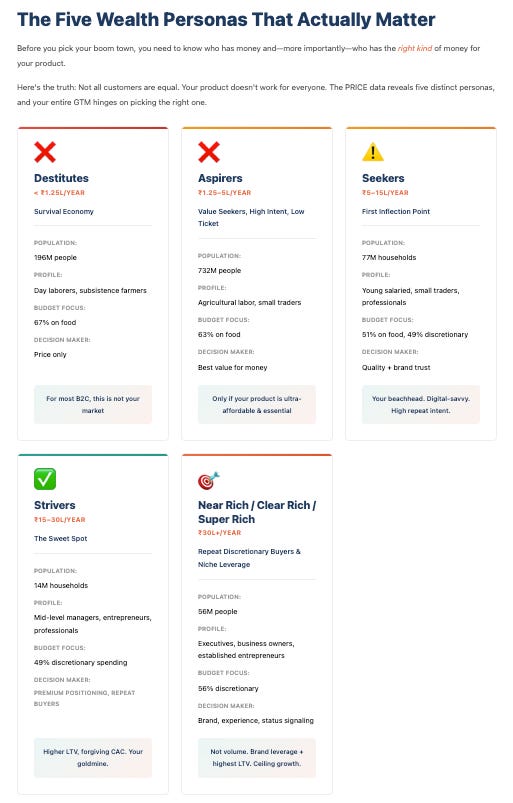
India isn’t one market. It’s 307.6 million households distributed across 8 distinct income segments each with different behaviors, different spending patterns, and different geographic concentrations.
Here I am using the demographic personas defined by PRICE Non profit for illustrations.
Most founders think of the middle class and imagine one homogenous group. The reality? India’s income pyramid has eight layers, and your product fits exactly one or two of them.
India’s 8 Household Income Segments: The Complete Map
Here’s the actual structure of Indian household income in 2020-21, based on PRICE’s ICE 360° surveys of 40,000+ households:
The Poor (206 Million Households | 67% of India)
1. Destitutes (₹0-1.25 lakh annual income): 45 million households
Share of population: 14%
Annual growth: -0.6% (shrinking)
Average household income: ₹73,000
Average expenditure: ₹82,300 (they spend MORE than they earn)
Geographic concentration: 83% rural, primarily Left-Behind Rural areas
Your strategy: If your product costs more than ₹500, this isn’t your customer. Period.
2. Aspirers (₹1.25-5 lakh annual income): 161 million households
Share of population: 52%
Annual growth: 0.6%
Average household income: ₹2.56 lakh
Average expenditure: ₹2.58 lakh (barely breaking even)
Geographic concentration: 67% rural, 33% urban
Your strategy: These households are price-sensitive but aspirational. They’ll buy your product if it solves a genuine pain point AND the price is under ₹2,000. Sachets, installment plans, and “try before you buy” models work here.
The Middle Class (91 Million Households | 30% of India)
This is where the money is. ₹84 trillion in total household income. ₹62 trillion in spending power. ₹12 trillion in savings.
3. Seekers (₹5-15 lakh annual income): 77 million households
Share of population: 25%
Annual growth: 4.8%
Average household income: ₹9.25 lakh
Average expenditure: ₹6.84 lakh
Average savings: ₹1.29 lakh annually
Geographic concentration: 52% rural, 48% urban
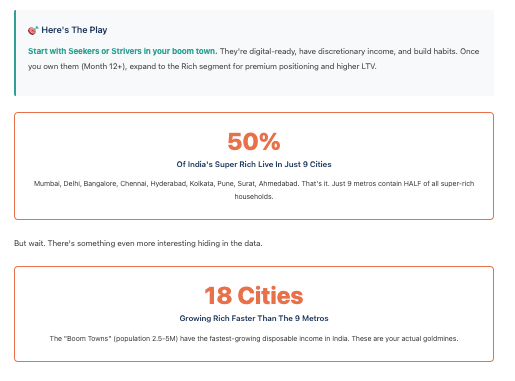
Your strategy: This is India’s growth engine. They’re entering discretionary spending cars, appliances, education, travel. Products priced ₹5,000-₹50,000 work here. They’re brand-conscious but still price-sensitive. This segment is heavily concentrated in boom towns like Nashik, Surat, Malappuram where they have 30%+ market share potential vs. 5% in metros.
4. Strivers (₹15-30 lakh annual income): 14 million households
Share of population: 4.5%
Annual growth: 6.4% (fastest-growing middle-class segment)
Average household income: ₹20.47 lakh
Average expenditure: ₹20.47 lakh
Average savings: ₹1.29 lakh annually
Geographic concentration: 60% urban, 40% rural
Your strategy: These households are confident spenders. They’ll pay ₹50,000-₹2 lakh for products that signal status or save time. Premium appliances, private education, international travel, luxury cars all in play. 54,000 Striver households in Nashik. 135,000 in Surat. That’s 200,000 households with ₹15-30 lakh income and zero competition.
The Rich (11 Million Households | 4% of India)
₹38 trillion in household income. ₹22 trillion in spending. ₹6 trillion in savings.
5. Near Rich (₹30-50 lakh annual income): 3.3 million households
Annual growth: 7.4%
Average savings: ₹6.06 lakh annually
Geographic concentration: 62% urban (heavily metro-concentrated)
Your strategy: Premium products ₹2-5 lakh. Luxury goods, international travel, private schooling, imported cars.
6. Clear Rich (₹50 lakh-₹1 crore annual income): 3.2 million households
Annual growth: 9.4%
Geographic concentration: 67% urban
Your strategy: High-ticket items ₹5-20 lakh. Second homes, luxury cars, international education.
7. Sheer Rich (₹1-2 crore annual income): 2.4 million households
Annual growth: 10.2%
Geographic concentration: 67% urban
Your strategy: Ultra-premium ₹20 lakh+. Multiple properties, luxury travel, wealth management.
8. Super Rich (₹2 crore+ annual income): 1.8 million households
Annual growth: 11.3% (fastest-growing segment overall)
Geographic concentration: 79% urban (50% live in Mumbai and Delhi alone)
Your strategy: If you’re not selling ₹50 lakh+ products or services, this isn’t your primary market.
Why This Changes Everything About Your GTM Strategy
Most founders make one of three mistakes:
Mistake #1: We’re targeting middle class India
Which middle class? Seekers earning ₹9 lakh annually or Strivers earning ₹20 lakh? That’s a 2.2x income difference. Completely different price sensitivity. Completely different purchase triggers.
Mistake #2: We’re launching in tier 2 cities
Which household segments live there? Nashik has 54,000 Striver households (₹15-30 lakh income) but also 205,000 Aspirer households (₹1.25-5 lakh). If your product costs ₹15,000, only 20% of Nashik can afford it. You just wasted 80% of your marketing budget.
Mistake #3: We’ll target urban India
48% of Seeker households (₹5-15 lakh income) live in rural India. 40% of Striver households (₹15-30 lakh) live in rural India. If you’re ignoring Developed Rural areas (160 districts with high infrastructure and income), you’re missing 40 million middle-class households.
The Precision Playbook: Two Dimensions, Not One
Winning founders don’t just pick a city. They pick a household segment in a geographic cluster.
Example 1: Meesho
Target segment: Seekers (₹5-15 lakh income) + Aspirers (₹1.25-5 lakh)
Geographic focus: Tier 2/3 cities + Developed Rural
Result: 80%+ of orders from tier 2/3 cities. ₹1 billion+ revenue. 100 million users.
Example 2: Fyn Mobility
Target segment: Strivers (₹15-30 lakh) + Near Rich (₹30-50 lakh)
Geographic focus: Chandapura, Yeshwantpur, Mahadevapura micro-townships
Why: Highest density of quick commerce = highest density of Striver/Near Rich households needing EV logistics
Result: Category leadership in target micro-market. Path to profitability. Scaled from strength.
Example 3: Pinduoduo (China)
Target segment: Tier 3/4/5 city households (China’s equivalent of Seekers)
Geographic focus: Small cities Alibaba abandoned
Result: ₹15 billion GMV in 2 years. 900 million users. China’s 3rd largest e-commerce platform.
How to Pick Your Segment + Geography Combination
Here’s the framework we use with founders:
Step 1: Define Your Affordable Segment
What’s your product price point?
₹500-2,000: Aspirers (₹1.25-5 lakh income) = 161 million households
₹2,000-10,000: Seekers (₹5-15 lakh income) = 77 million households
₹10,000-50,000: Strivers (₹15-30 lakh income) = 14 million households
₹50,000-2 lakh: Near Rich (₹30-50 lakh income) = 3.3 million households
₹2 lakh+: Clear Rich and above (₹50 lakh+ income) = 7.4 million households
Step 2: Map Segment Concentration by Geography
Use household income data (PRICE ICE 360°, Census wealth indices, district-level consumption data) to answer:
Which boom towns have the highest concentration of my target segment?
Where is competitive intensity lowest for this segment?
Where can I achieve 30%+ market share with ₹40K spend?
Example data points:
Seekers (₹5-15 lakh) concentration:
Nashik: 171,000 Seeker households (32% of city)
Surat: 522,000 Seeker households (31% of city)
Malappuram: High per-capita banking deposits = high Seeker concentration
Vs. Bangalore: Seekers are only 20% of households (diluted by Rich segments)
Strivers (₹15-30 lakh) concentration:
Nashik: 54,000 Striver households
Surat: 135,000 Striver households
Jaipur: 191,000 Striver households
Vs. Mumbai: Strivers exist but CAC is 2-3x higher due to competition
Step 3: Build Density, Not Presence
Don’t launch in 5 cities targeting “middle class.”
Launch in 1 boom town targeting Seekers or 1 micro-township targeting Strivers.
Build 30%+ market share. Hit unit economics. Document the playbook. Then scale.
The precision playbook isn’t just picking Nashik over Bangalore.
It’s picking Seeker households in Nashik over Seeker households in Bangalore.
It’s picking Striver households in Mahadevapura over Strivers scattered across Bangalore.
Geographic precision + household precision = market dominance.
The Boom Towns Are Waiting. And They’re Growing Faster Than You Think.
Let me leave you with one final data point that should change how you think about India:
By 2030 just 6 years from now India will have 715 million middle-class consumers. That’s up from 432 million today.
It’s happening in Developed Rural areas 160 districts with infrastructure, income, and zero competition.
This Is Your Moment
If you want the same precision approach we brought to Fyn Mobility’s GTM strategy, the one that’s driving category leadership, let’s talk.
Credits: I want to accord my special thanks to the PRICE non profit for the incredible work they are doing across the Indian demographics data. I have used their approach for illustration within the blog.